Testing Smart Animate in Figma with Graphs
Recently our team here at Snowball started using Figma as a tool for UI/UX design. Overall we are very pleased with a lot of the features that Figma gives us compared to the two design tools we converted from, Sketch and Adobe XD.
Figma and Smart Animate
Figma launched Smart Animate on October 3rd. As an animation-enthusiast, I was thrilled to hear about this new feature. Though in its early stages, it still works very well for some of the animations you need to get life into a prototype. Yay for easily making prototypes to show our customers.
In this release Smart Animate supports these features:
- Scale
- Position
- Opacity
- Rotation
- Fill
Visualizing graphs
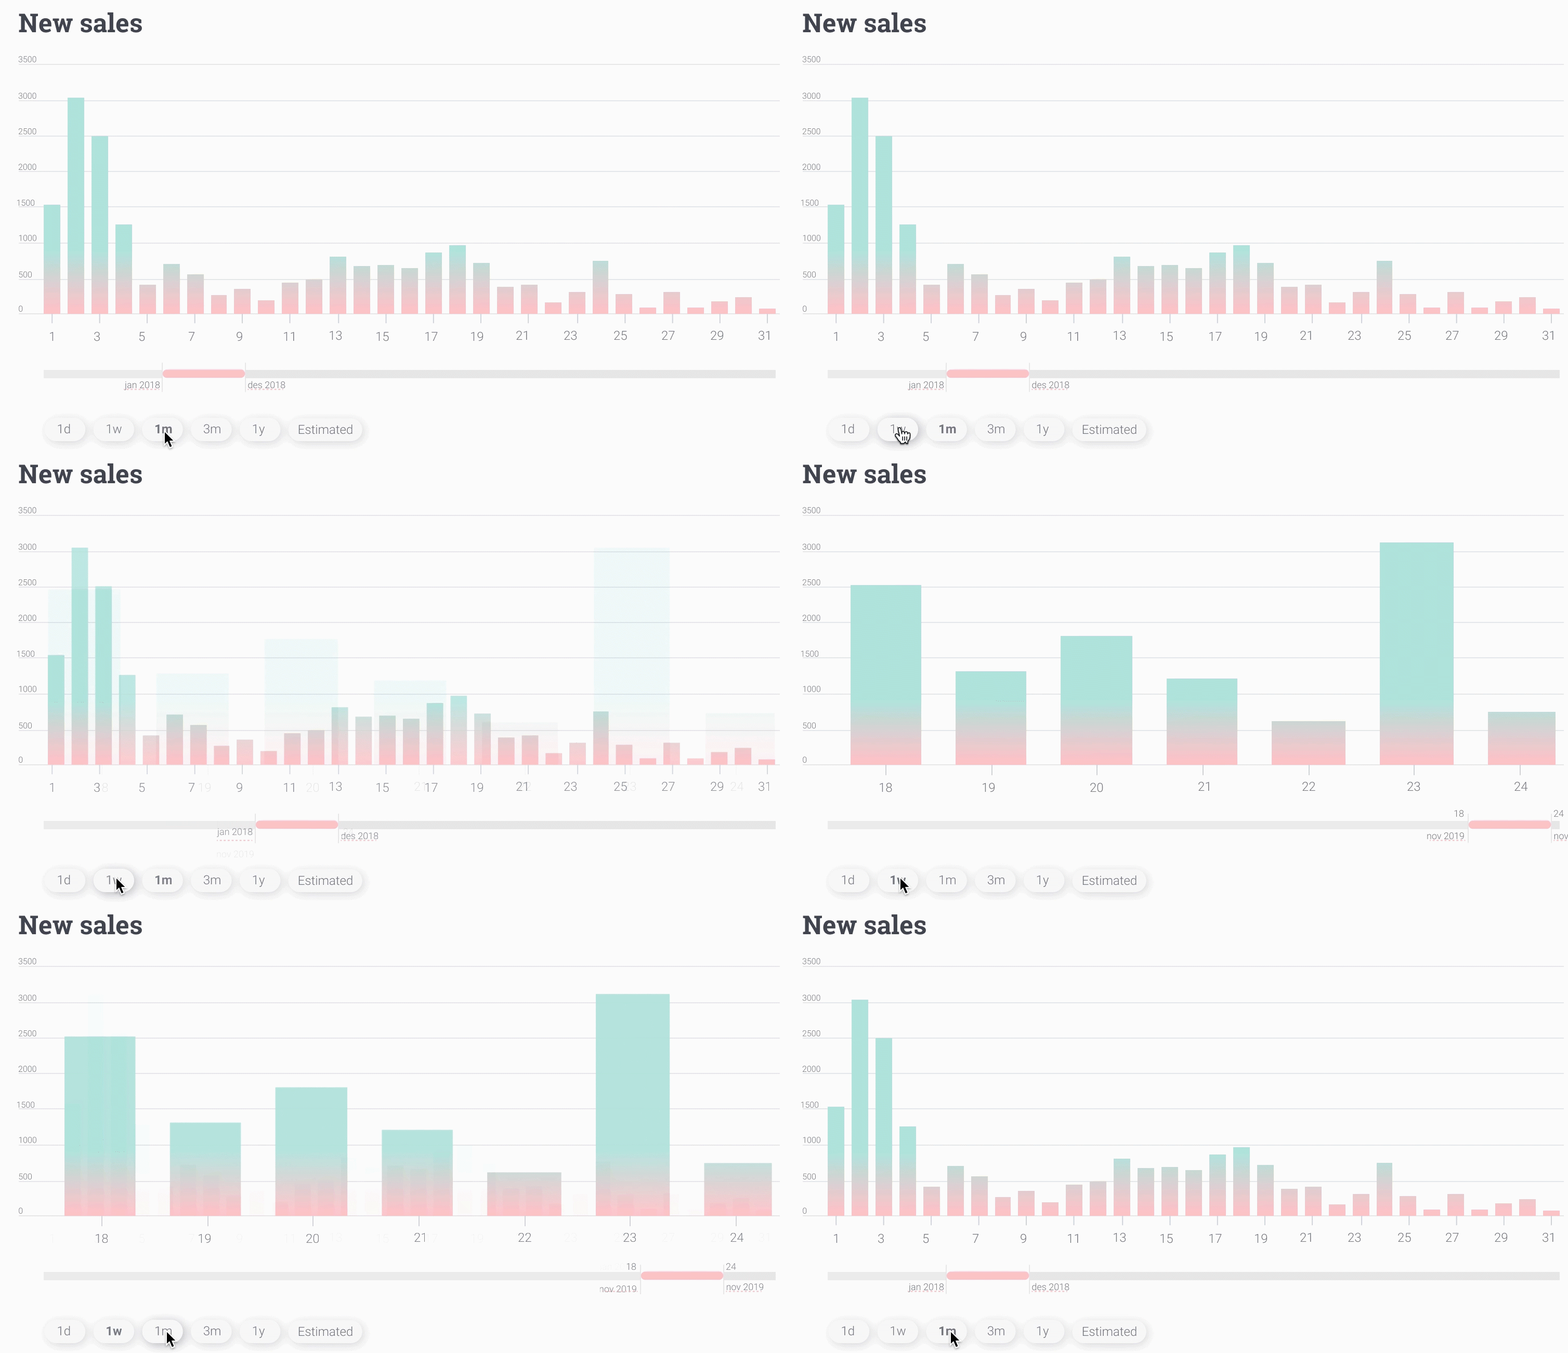
Though maybe not entirely fair to a feature in its early stages, I tried to make sense of some sketches for reporting in our headless e-commerce Crystallize. So I took it to the test of visualizing data.
The graphs I had were almost all stroke-based. This turned out to be a problem. Smart Animate doesn’t seem to understand the changes in shapes entirely stroke-based. Even simple shape changes as a stroked line prolonged. Though I had some success if I just changed one or two lines. The result was quite strange looking with these seven lines, and Figma crashed a couple of times.

My solution was to change the stroked lines to rectangles. That made the fill and the size possible to animate and the results quite good.

Animate between shapes
As far as I can see it’s not yet possible to animate a simple line graph. I hope that Smart Animate will have this included in an update soon. Then this could also become a great tool for visualizing graph-heavy UI-design.


